Video Quality Monitor
Video Quality Monitor (VQM) is certainly the most powerful and the most flexible solution to measure video quality, audio quality and lip-sync from video and audio files, HDMI (Set-Top Boxes...), SDI, ASI, IP streaming (UDP, RTP, HTTP, HTTPS, HLS, MPEG-DASH, RTSP, RTMP, SRT ou NDI®) or desktop capture
Measurement and monitoring of perceived video quality, perceived audio quality, audio loudness, blockiness, blur, contrast, flatness, jerkiness, rebuffering, black frames, zapping times, time to start video, noise, bloom, silences, saturations, actual frame rate, actual video bitrate, actual audio bitrate, video stability and contrast modulation
with dedicated perceived video quality metrics for HEVC (H.265), MPEG-4/AVC (H.264) and MPEG-2
VQM can also measure lip-sync (synchronization between audio/video) using audio/video test signals which can be customized
VQM is scriptable. VQM can control and test Set-Top Boxes : benchmarking, firmwares validation, development of new services, etc.
VQM can manage thousands of audio/video files.
VQM can even record GPS coordinates to measure video quality with respect to localization for field testing of 5G, 4G, 3G or Wifi networks.
And much more...
VQM is a must-have.
Note:
- If you are looking for a similar solution for live audio/video signals (IP streaming, HDMI, SDI, ASI, etc.) but with full reference, try "Full Reference Video Quality Monitor".
- If you are looking for a similar solution for audio/video files but with full reference metrics, try "Video Quality Analyzer".
In 2016, 2017, 2019 and 2023, Video Quality Monitor received these awards:


Video Quality Monitor (VQM) is a precise and very flexible solution to measure and monitor video quality, audio quality and lip-sync as perceived by end-users (also called QoE: Quality of Experience) from audio/video files, HDMI (Set-Top Boxes...), SDI, ASI, IP streaming (UDP, RTP, HTTP, HTTPS, HLS, MPEG-DASH, RTSP, RTMP, SRT or NDI®) or desktop capture.
Using AI and more specifically machine learning, VQM produces perceived video quality scores expressed on a MOS (Mean Opinion Score) scale and correlated with human judgment of video qualty. VQM's perceived video quality metrics are dedicated to HEVC (H.265), MPEG-4/AVC (H.264) and MPEG-2 video encoding formats. These video quality metrics have been optimized to produce quality scores which are highly correlated with human jugdments collected during subjective quality assessment tests in normalized conditions (ITU BT.500 and ITU BT.710).
VQM enables to measure and monitor perceived video quality and audio quality from:
- audio/video files, without reference
- live audio video sources: HDMI, SDI, ASI, IP streaming (in UDP, RTP, HTTP, HTTPS, HLS, MPEG-DASH, RTMP, RTSP, SRT or NDI®), Windows desktop capture, in real time, without reference
- streaming services (like youtube, dailymotion or any other streaming service) using any web browser or player
VQM measures/detects/monitors in real time:
- video quality (MOS)
- audio quality (MOS)
- synchronization between audio and video (lip-sync)
- blockiness (sometimes called "blocking effect"), blur (sometimes called "blurring"), contrast, jerkiness (sometimes called "image freezing"), rebuffering durations, black frames, silences, saturations, actual frame rate, actual video bitrate, actual audio bitrate
- audio loudness according to recommendations ITU BS 1770-2 and EBU R128 (as required by the CALM: Commercial Advertisement Loudness Mitigation Act)
- audio or video signal loss
VQM is useful for:
- benchmarking, validation and monitoring of TV services
- test and validation of Set Top Boxes (STB) and other audio/video devices
- benchmarking of video-conferencing systems
- monitoring of file-based encoding (example: encoding for VOD)
- measurement of the impact of rebuffering events on perceived video quality (rebuffering is when streaming video is paused for a while in order to buffer more data)
- video cameras benchmarking and comparison using the camera noise metric
- screens benchmarking and comparison using the bloom metric
- screens and video cameras benchmarking and comparison using the Contrast Modulation (CM) metric
VQM can also:
- trigger alerts by email and SNMP when problems happen
- measure video quality and/or audio quality measurement depending on position (with GPS data: latitude, longitude, altitude, number of satellites) for 5G/4G/3G/Wifi field testing
- generate geographical maps of video quality and/or audio quality depending on GPS position
- measure zapping time
- save video samples when problems happen (from a few frames before the problem, until a frew frames after the problem)
- detect the most complex scenes in long videos (to prepare complex videos for video encoders benchmarking)
- measure the synchronization between audio and video (lip-sync)
- process HDR (High Dynamic Range) videos and extract features like colorspace, MaxFALL and MaxCLL
VQM supports lots of different sources: video files, capture cards (HDMI, SDI, ASI, Composite, etc.), external capture devices, desktop capture and IP streaming in UDP, RTP, HTTP, HTTPS, HLS (HTTP Live Streaming), MPEG-DASH, RTSP, RTMP, SRT or NDI®. VQM includes no reference, parametric and hybrid video quality metrics. It means that when you want to measure the perceived video quality of a distorted video, you just have to provide this video. For parametric and hybrid metrics, the video must be in a compressed format.
For monitoring of file-based encoding (example: encoding for VOD): VQM can process several files in parallel. This is particularly useful to process a large number of files (using the Watch Folder for example). VQM can even test the decodability of audio and video at about 40x speed (on a simple PC) and count the number of decoded audio samples and video frames. And if these values are different than the expected values (based on header information), VQM can send you alerts.
Starting VQM
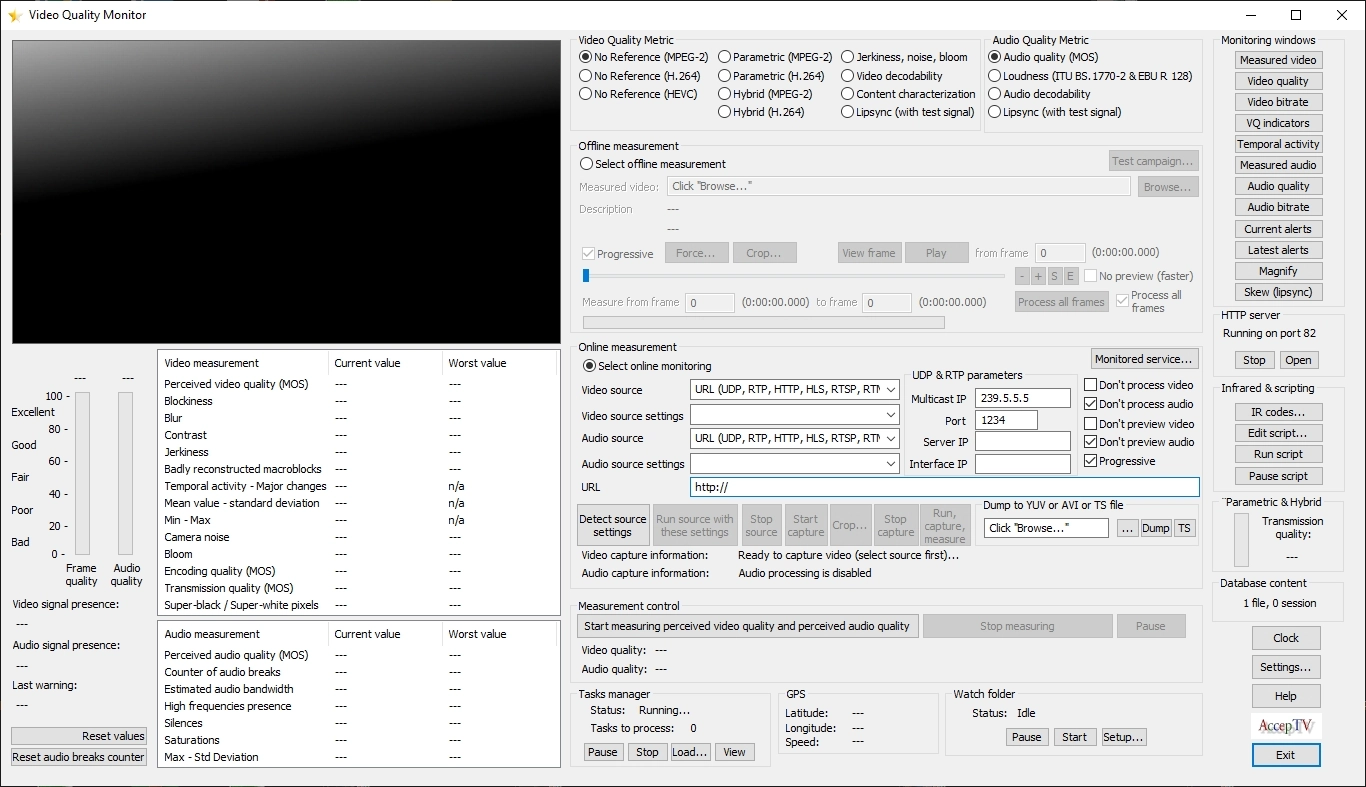
At start up, VQM displays a window showing a preview frame of the tested video (the video that you want to measure). To start using VQM, you generally use the "offline mode", click the "Browse..." button in order to select a video file and load it.
But VQM can also measure in real time the quality of video being captured live: that's the "online mode". In this case, VQM can process live video and/or audio from an HDMI, SDI or ASI capture device (or an external capture device), from IP streaming (using UDP, RTP, HTTP, HTTPS, RTSP, RTMP, SRT or NDI®) or from Windows desktop capture.
VQM supports the most common encoders (HEVC (H.265), MPEG-4/AVC (H.264), MPEG-4/SP, MPEG-2, ...)) and the most common containers: AVI, MP4, TS, MOV, WMV, Raw YUV, PS, ES, ...
Videos loading
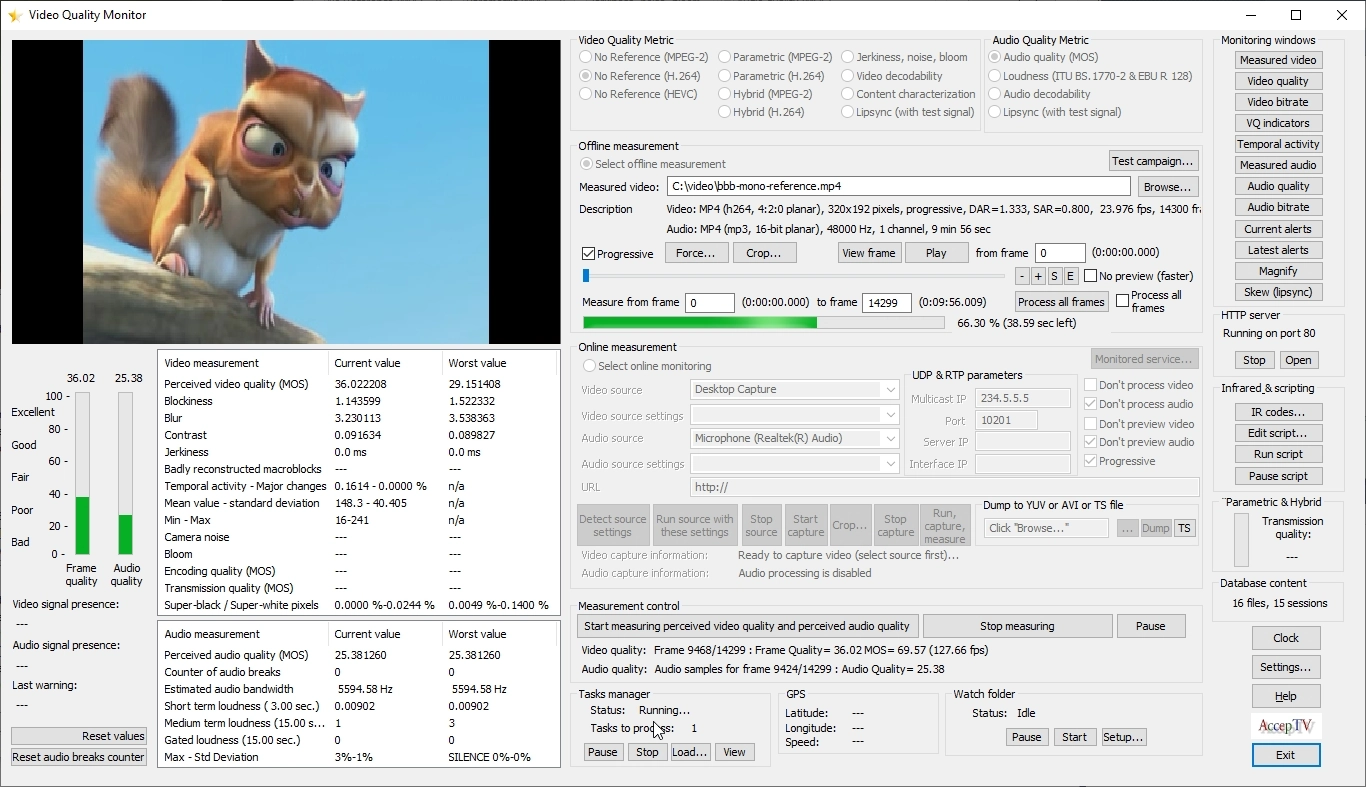
Once a video is loaded, its first frame is displayed. The parameters of its video and audio streams are also displayed: codec, frame dimensions, frame rate, number of frames, duration, audio sampling rate, audio duration, etc.
For real time quality monitoring, the "online" mode enables to choose a live video/audio source : an HDMI, SDI or ASI capture card (or an external capture device), IP streaming (using UDP, RTP, HTTP, HTTPS, RTSP, RTMP, SRT or NDI®) or Windows desktop capture (to process a YouTube window for example).
VQM's graphical user interface also displays many useful information. All the parameters that you could need are displayed and are editable.
Measuring perceived video quality
During video quality measurement, several windows can be displayed: measured video frame, audio waveform and spectrum, quality curves, video bitrate curve and audio bitrate curve.
In parallel of quality measurement, the instant video bitrate and instant audio bitrate are also measured for each video frame/audio frame. For live audio/video sources (HDMI, SDI, ASI, IP streaming, desktop capture), the actual frame rate is also measured.
Quality measurement uses multithreading. So the more CPU cores you have, the faster VQM works.
Web server
So far, we've only described the main features of the main interface which is used for:
- selecting a video quality metric
- loading a video
- starting the quality measurement step (and waiting until it's finished)
That's good but the best is yet to come...
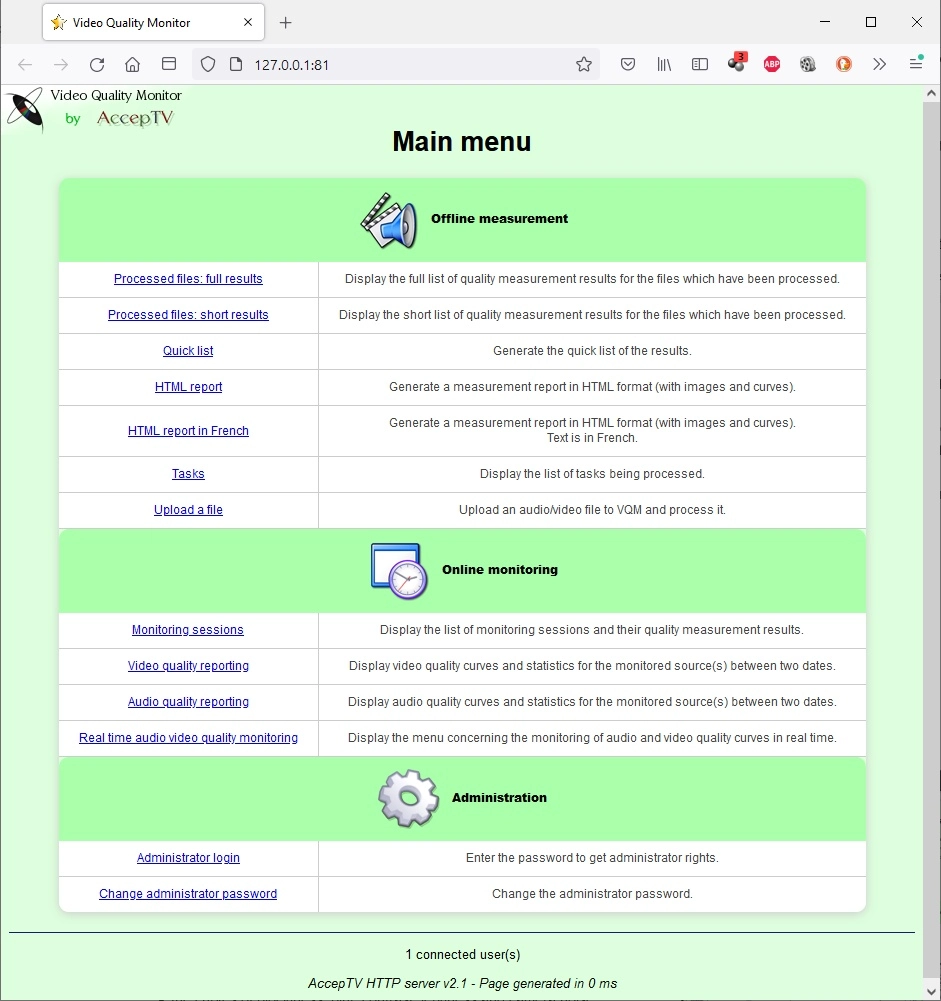
To provide detailed reporting, VQM includes its own web server. There is no need to install a separate server (like Apache): VQM's web server is already fully included in the application. This web server enables you to connect from anywhere and get the measurement results, statistics, curves and even quality analysis reports (in several formats, including HTML format so that you can copy/paste it or load it in your favorite word processor, like Microsoft Word for example).
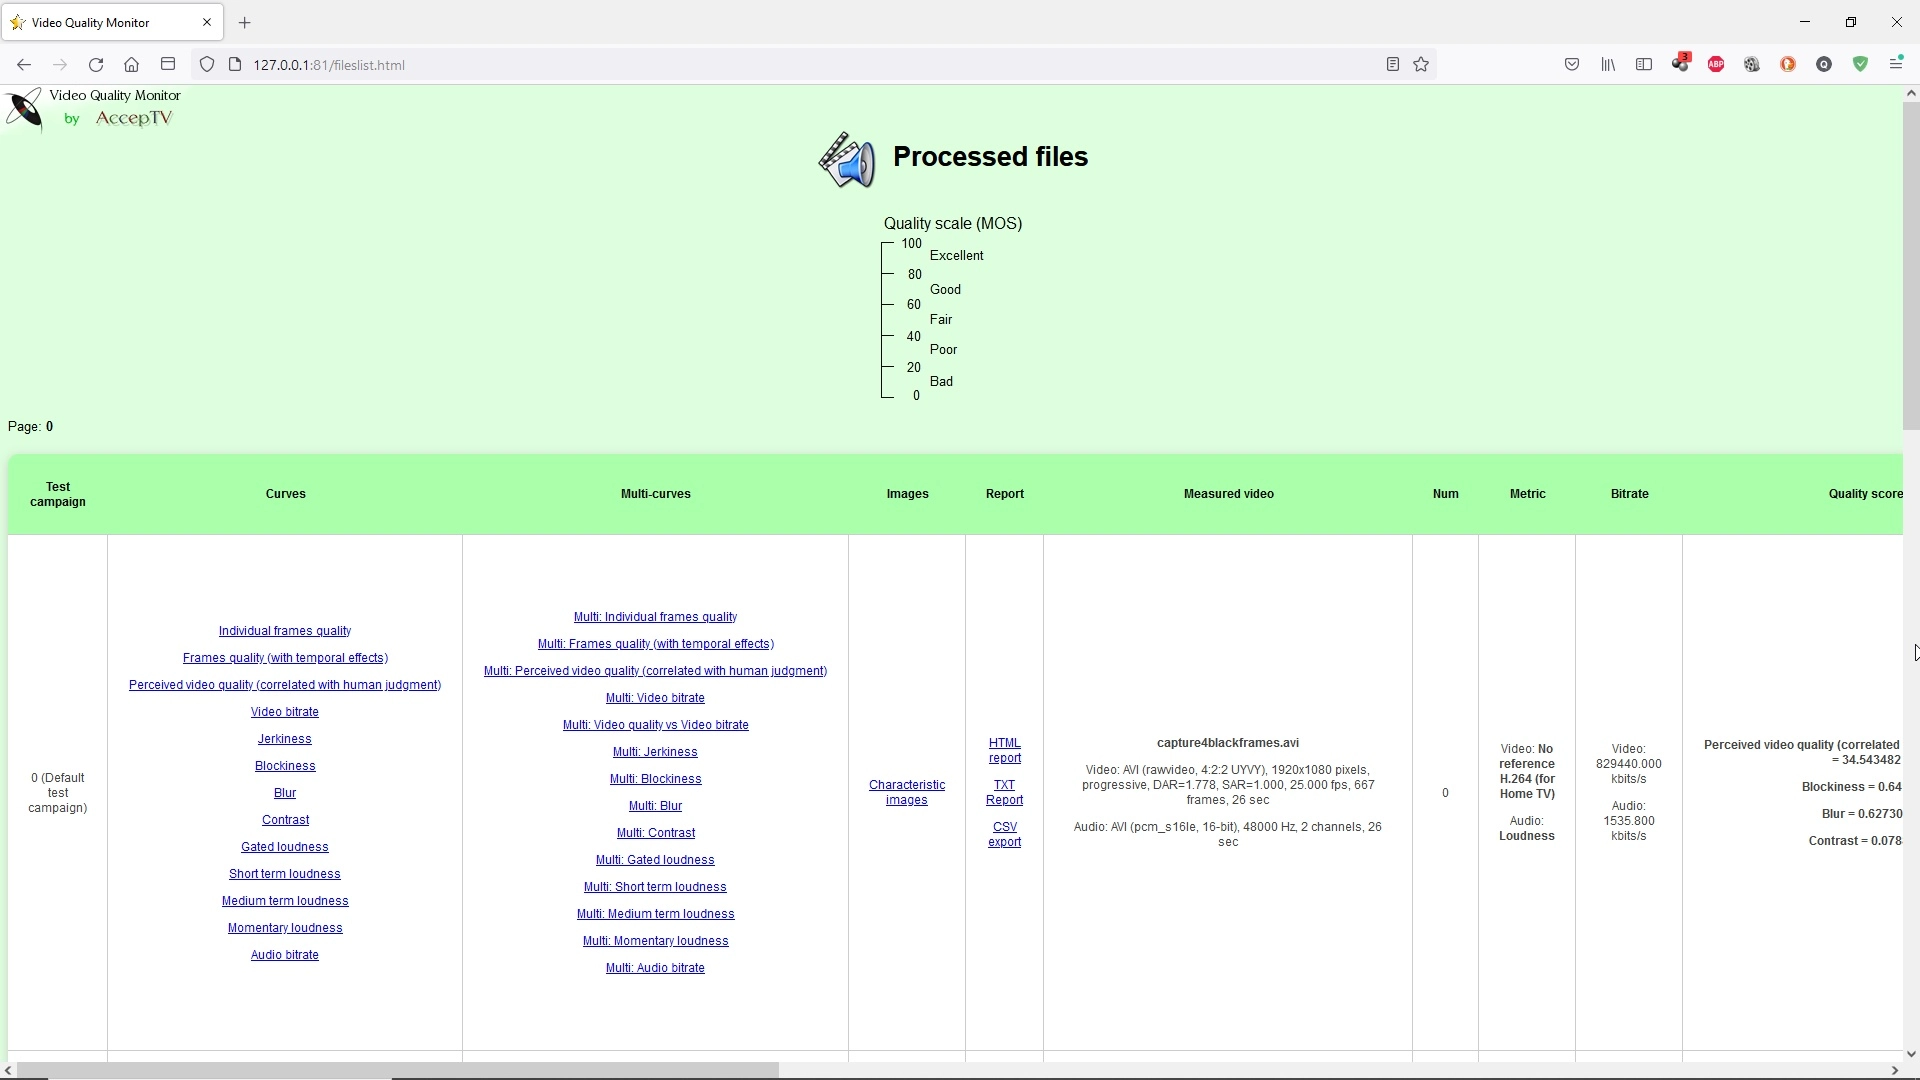
Results
For offline measurement results: In the main menu, the most frequently selected choice displays the list of processed videos. In this list, each video is represented by a unique number, its test campaign (that enables to gather several results), its file name, its full path, the description of its video and audio streams (codec, dimensions, frame rate, duration, etc...), its video quality score and statistics on video quality (min, max, standard deviation).
For each video, several links enable you to display:
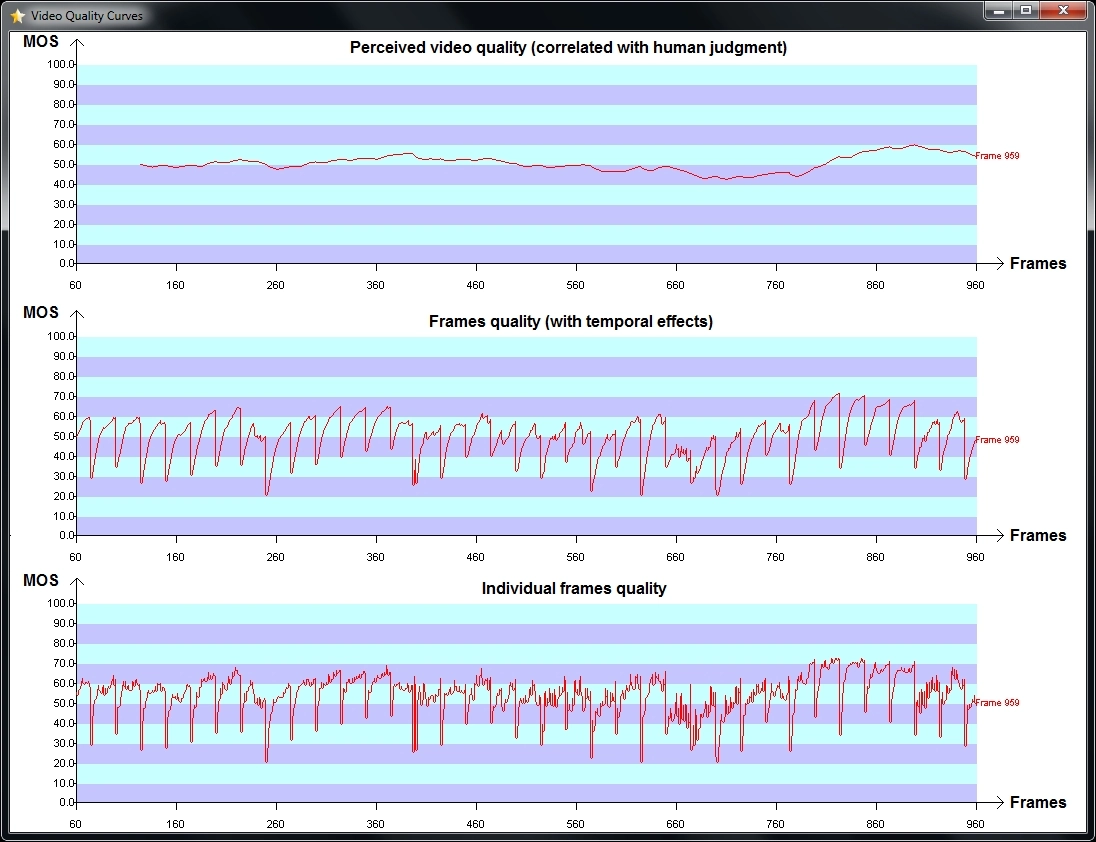
- quality curves
- bitrate curves
- curves of blockiness, blur, contrast, flatness, jerkiness and camera noise.
Some other links permit to draw various representations of the perceived quality versus the bitrate or to display the characteristic frames. At last, some links allow to generate perceived video quality analysis reports in various formats (CSV, TXT, HTML).
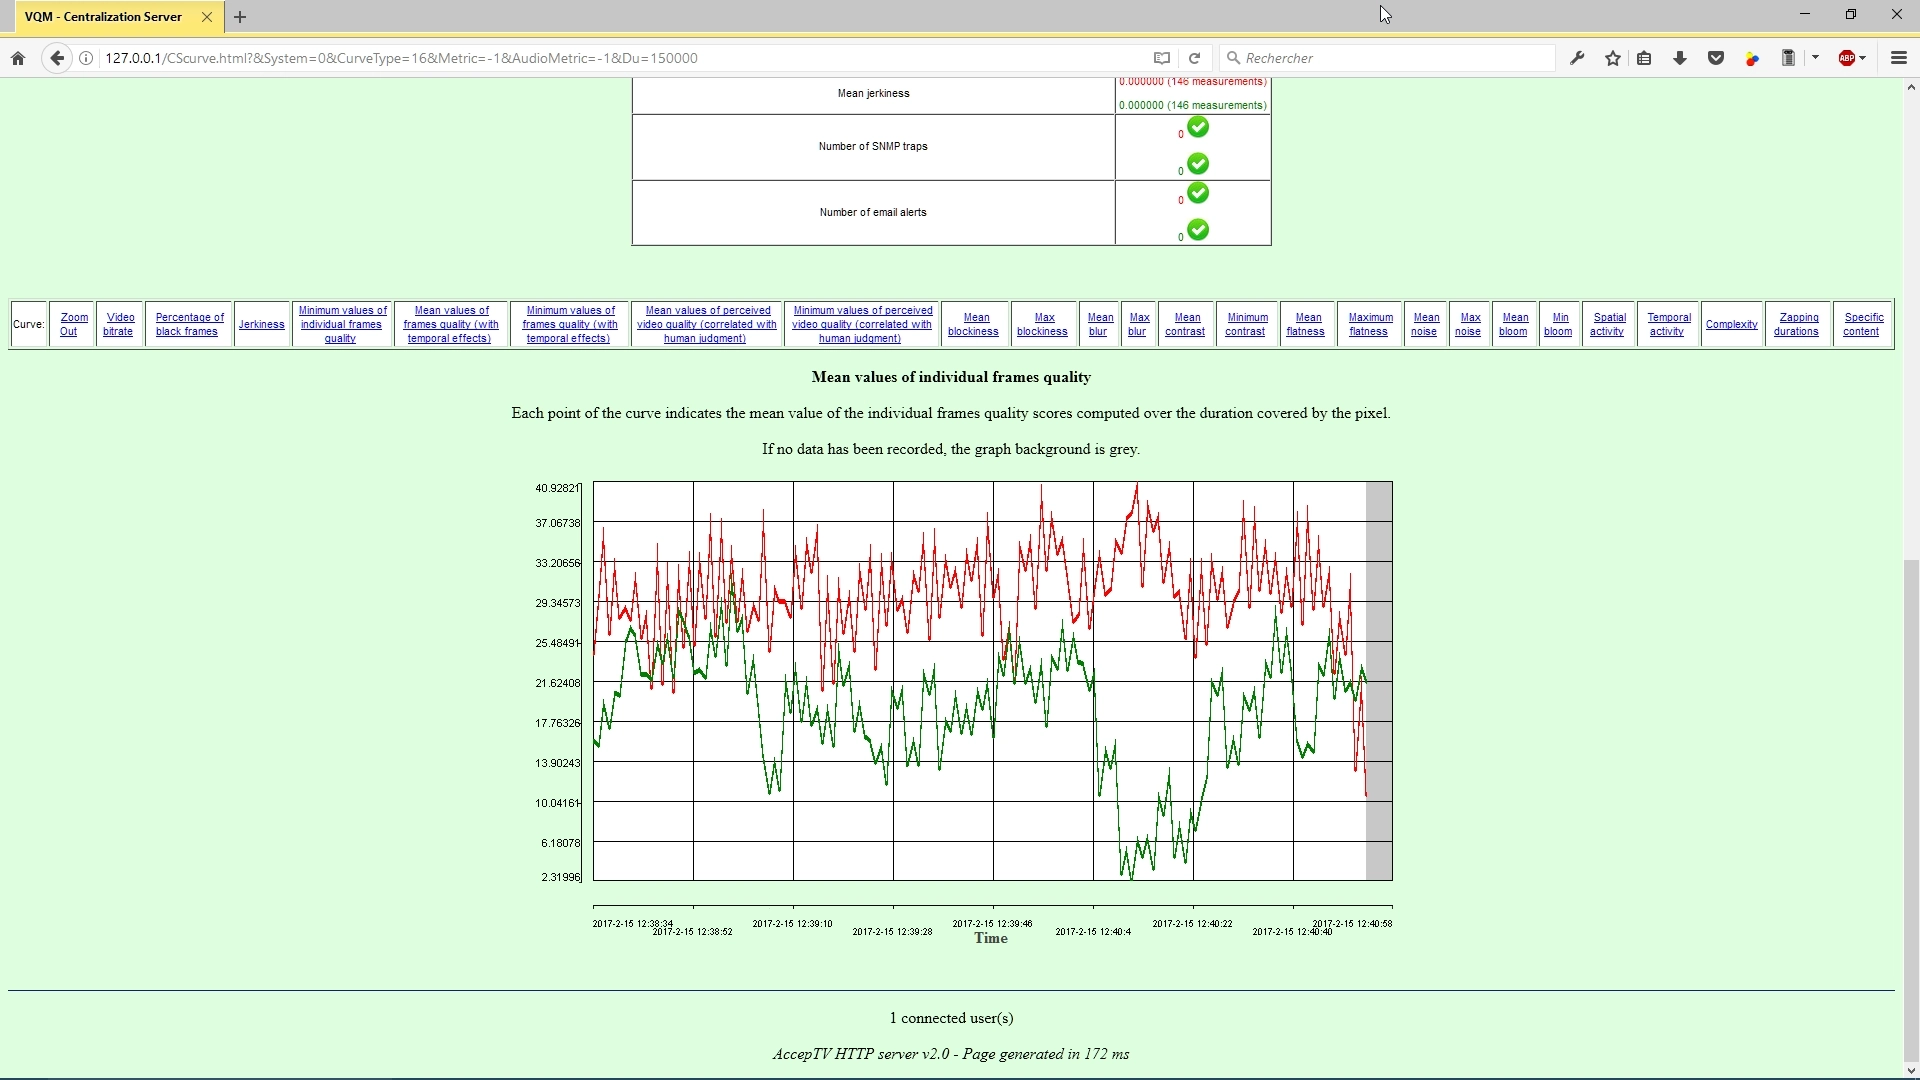
For online monitoring results: Results (quality curves, bitrate curve, curves of blockiness, blur, contrast, jerkiness, rebuffering durations...) can be drawn between two user-chosen dates and times. The curves can also be drawn in real time, permitting to remotely see VQM's monitoring activity.
Curves
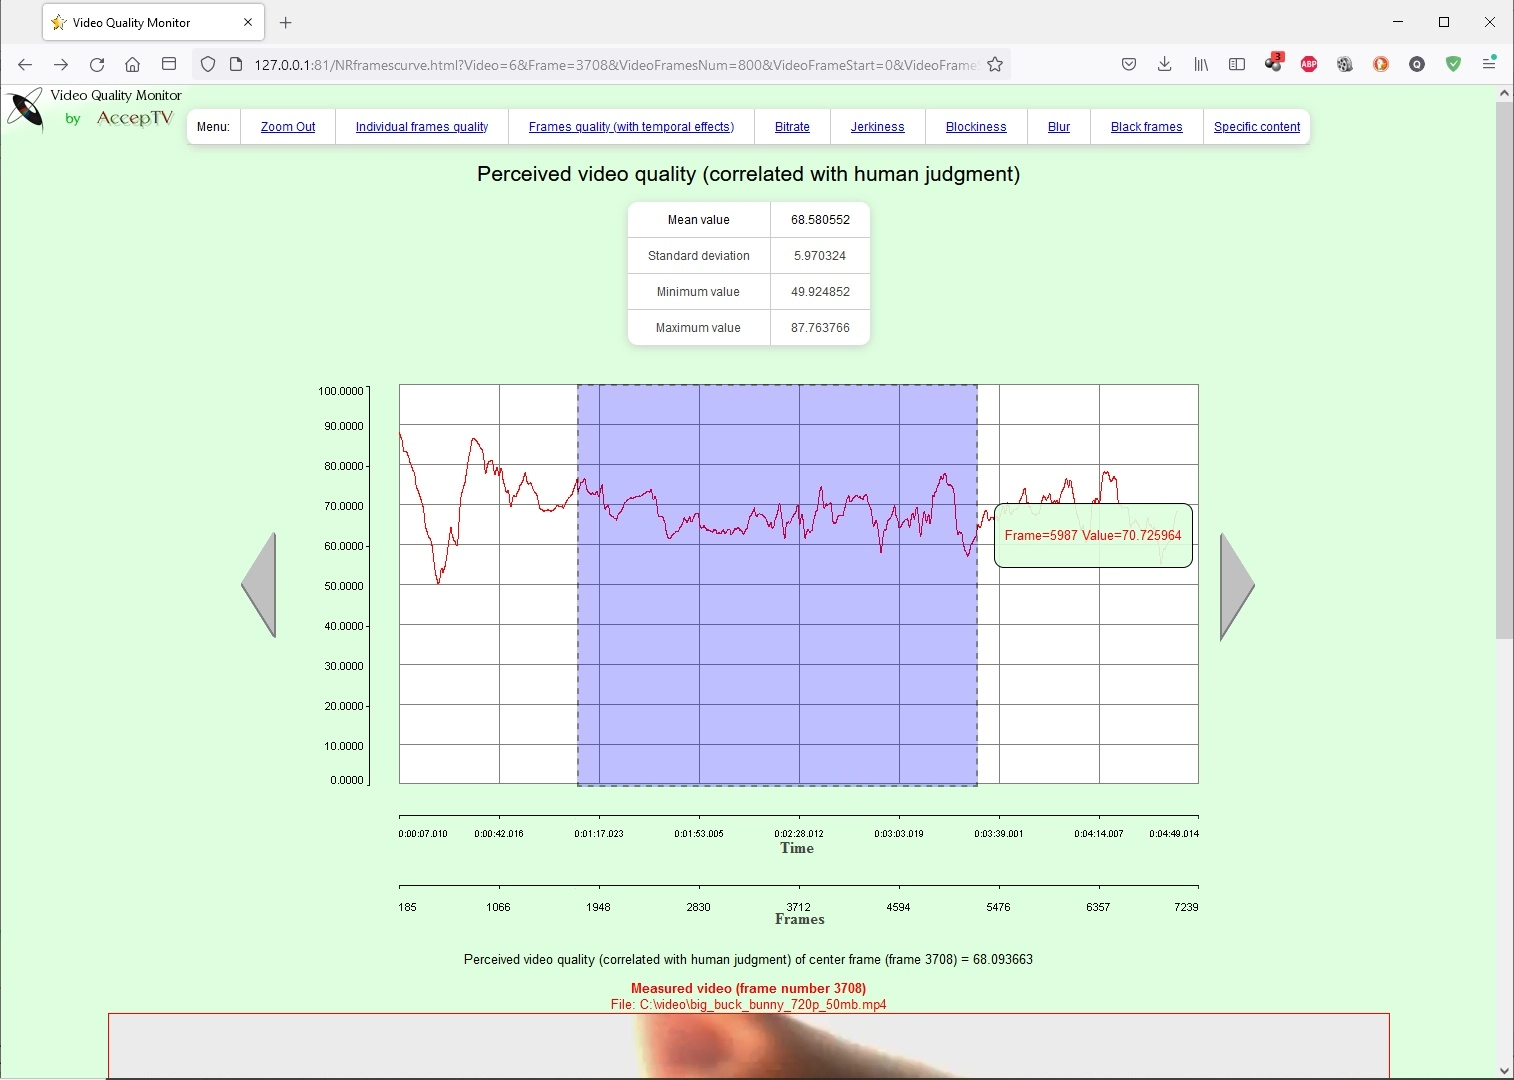
In the web interface, audio and video curves are interactive.
Just click on a point of the curve and it will put this point at the center and zoom by a factor of 2. And select a portion of the curve (by dragging your mouse), it will zoom on this selection. If the frame corresponding to the center of the curve is a characteristic frame, then this frame will be displayed below the curve. And if you have processed several versions of the same video (at different bitrates, for example), you can draw all their curves on a single figure to easily compare them.You can also get graphical representations of "perceived quality versus bitrate".
This will enable you to determine the bitrate which is required to get a given quality level.
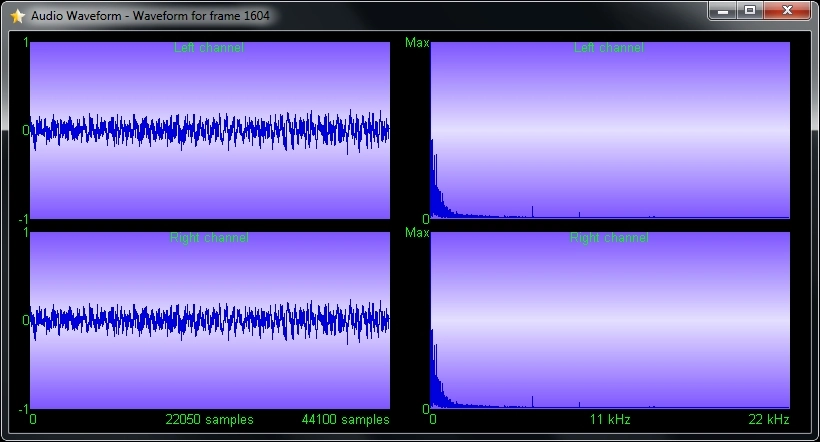
Audio
VQM can also measure:
- audio quality (based on bandwidth estimation, audio breaks, saturations and silences)
- loudness, according to international recommendations ITU BS 1770-2 and EBU R128
- audio bitrate
The measurements are made on the decoded audio waveforms and VQM supports the most common audio formats. To use a particular format, you'll just have to install the appropriate audio decoder.
In the main interface, a button enables to manually reset the audio breaks counter.
Loudness
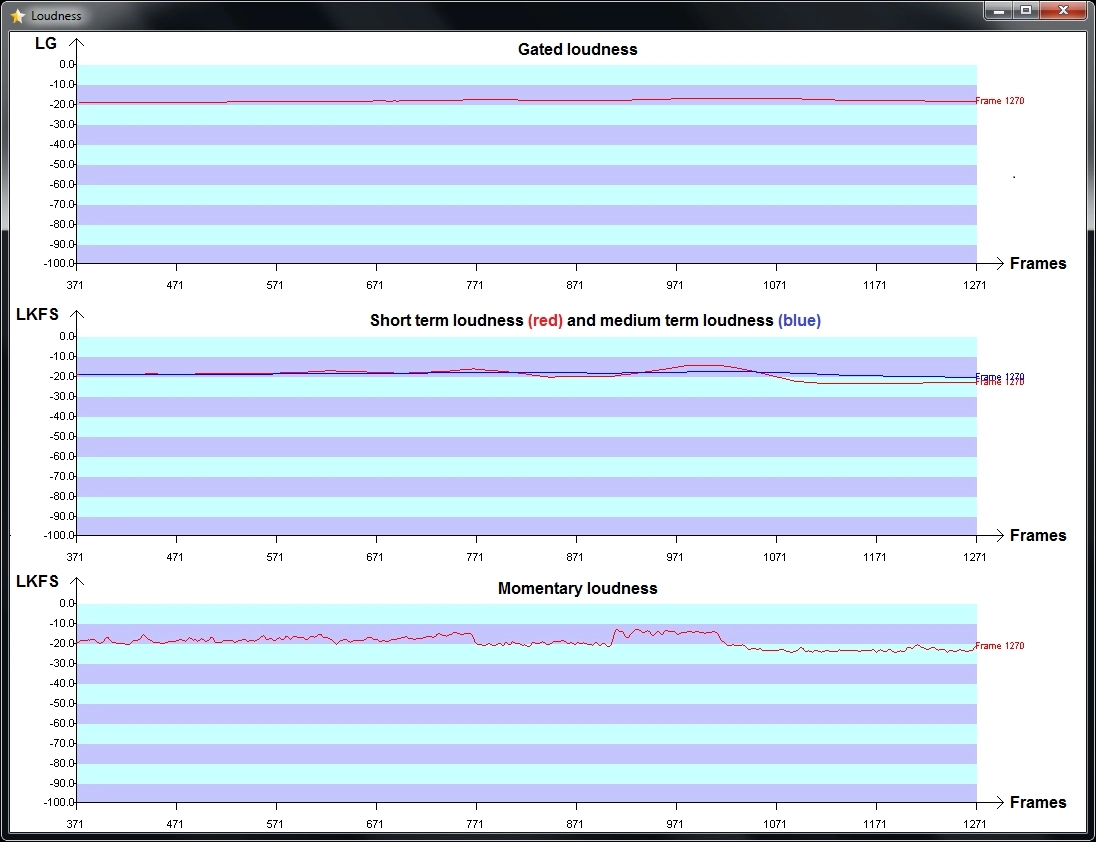
VQM can measure audio loudness according to international recommendations ITU BS 1770-2 and EBU R128. This loudness measurement computes 5 different values:
- Momentary loudness (denoted "M" in "EBU mode"): instant value of loudness.
- Short term loudness (denoted "S" in "EBU mode"): mean value of loudness over 3 seconds.
- Medium term loudness: mean value of loudness over 15 seconds.
- Gated loudness: mean value of loudness over 15 seconds, ignoring the values which are below two thresholds (first threshold is absolute and equal to -70 LKFS, second threshold is relative and equal to mean value of remaining loudness measurements after first thresholding minus 10 LKFS).
- Integrated loudness (denoted "I" in "EBU mode"): mean value of loudness over all the duration of the audio signal (even if the values proposed by EBU are recommended).
Loudness can be computed in both online and offline modes. This permits to monitor loudness in real time but also to measure loudness from captured signals (like audio video recordings).
Like the other measured data, all measured loudness values are saved and can be retrieved thanks to the web interface.
VQM can also trigger alerts if loudness is greater than a user-defined threshold.
At last, the integration durations for short term, medium term and gated loudness can be modified by the user.
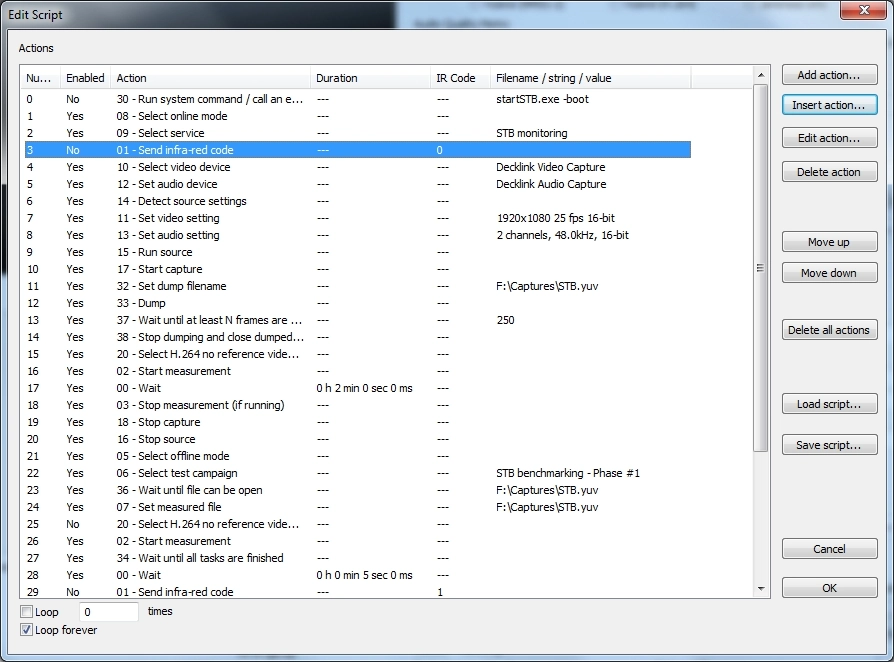
Scripts and TV remote control emulation
VQM also supports scrips execution. Using scripts, you can program VQM to do many different things. For example, you can make VQM monitor several TV channels or several IP streams.
VQM can also simuate a TV remote control by sending infra red codes or HTTP commands to a Set-Top Box (STB).
For example, this enables to control a Set-Top Box (STB) in order to test and validate it.
Each script contains actions enabling to control VQM's functions.
Scripting is available for both online and offline modes.
GPS
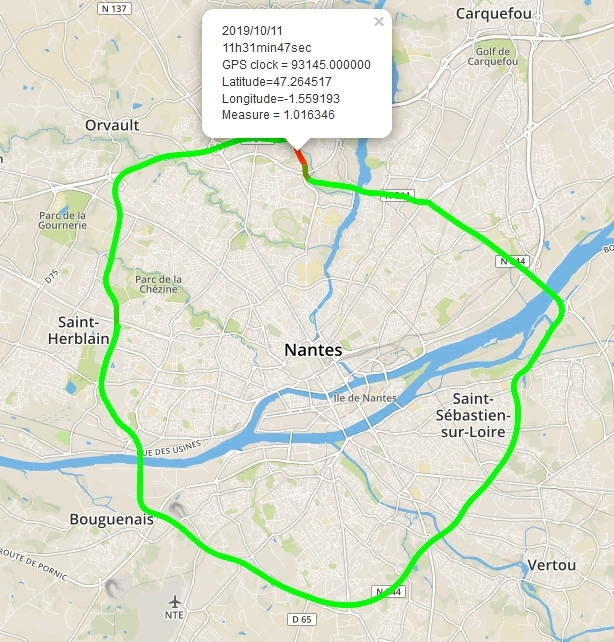
VQM can use a USB GPS antenna (like a bu-353s4 receiver) to record positions during video quality and/or audio quality measurement.
Then each measure is associated to its GPS information (latitude, longitude, altitude, number of used satellites, GPS clock).
VQM can generate maps showing video quality and/or quality with respect to GPS position.
This map indicates the video quality during the playing of a 4K video from YouTube via 4G in a car driving around the city of Nantes, France. One can notice a zone (in red, on top) which is very badly covered by the operator under test.
Put VQM in a backpack or in a car and measure your video quality depending on your localization!
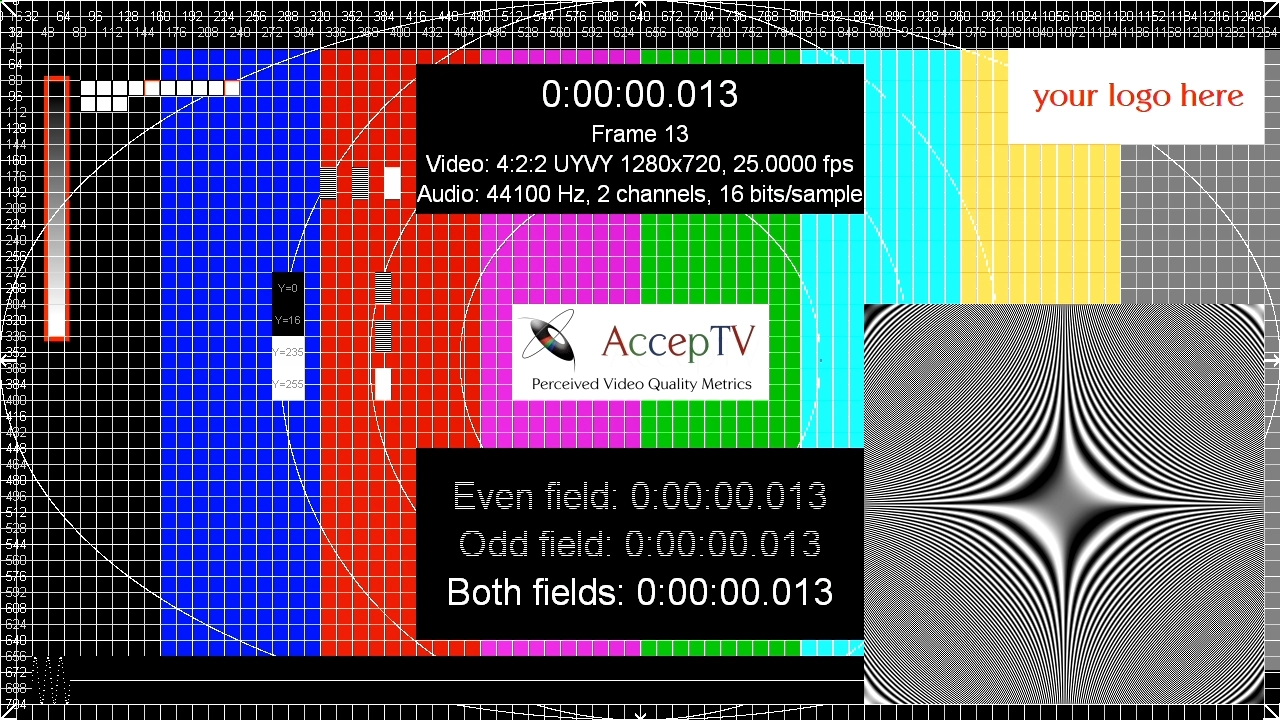
Generating audio/video test signals and measuring lip-sync
VQM can generate audio/video test signals and use them to measure the synchronization between audio and video (lip-sync).
The user can customize many parameters of the generated audio/video test signals:
- the file duration (in video frames)
- the video frames resolution
- the video frame rate
- the audio sampling rate
- the audio channels number
You can even insert your own logo in a test signal.
VQM then saves audio/video tests signals as AVI files containing uncompressed YUV 4:2:2 video frames and uncompressed 16-bit audio samples (PCM).
The audio and video streams contain synchronization marks which are designed to be robust regarding audio and video encoding distortions.
So you can encode this file using the audio/video codecs you want to test. And you can pass the audio/video signal through any system or broadcasting chain you must test.
Thanks to the sample-accurate and frame-accurate synchronization marks contained in the audio/video streams, VQM can compute the skew (misalignement between audio and vidéo) and express it in milliseconds, from a captured file or in real time from an HDMI, SDI or ASI capture device.
Other features
VQM contains many other features, among which:
- Tasks Manager: when you click on a button, you don't directly perform an action but actually you add a task in a queue. This enables you to continue loading files and measuring them, even if VQM is already working.
- Watch Folder: it enables to detect every file present or appearing (copied or moved) in specified folders (or in their subfolders). When a file is detected, its quality measurement is launched. The Watch Folder enables to process important numbers of files and to monitor a file-based encoding process using VQM (for VOD, for example)
- Automation methods: to facilitate the use of VQM with an important number of files, VQM can load scripts ou be used in command line (with arguments).
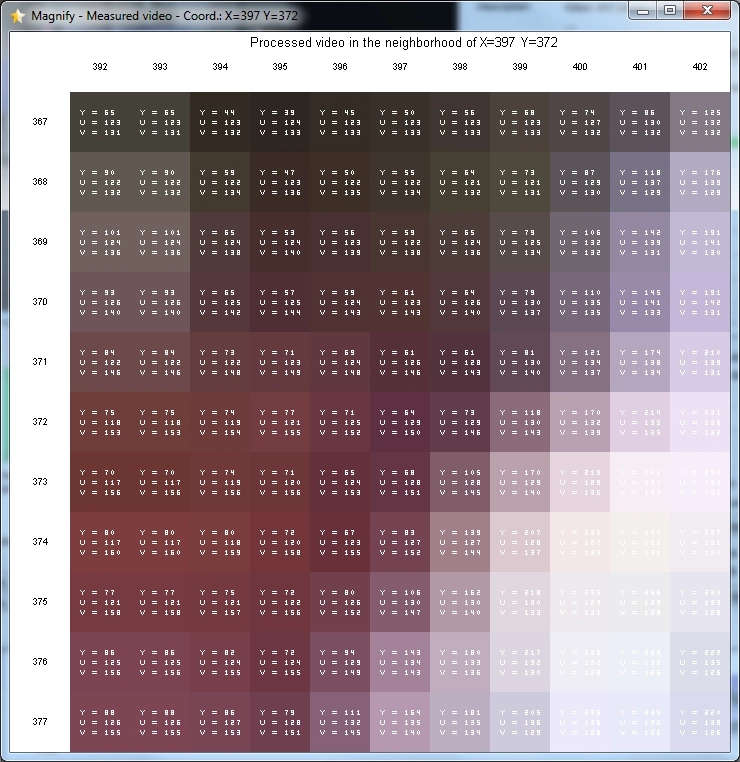
- Magnifying glass: to explore the image at pixel level and view the Y, U and V values of each pixel, a magnifying glass is available. This window shows the image content in the neighborhood of the mouse cursor's position.
Included for free: VQM Centralization Server
VQM is provided with a free tool called "VQM Centralization Server" (VQM CS).
VQM CS can be used in two different modes:
- The "QC mode" (Quality Check): VQM CS includes its own "Watch Folder" feature which can detect media files present or appearing in specified folders (and their subfolders). When a media file has been detected, VQM CS will order a VQM instance to process it, then it will receive its measurement results. Using several VQM instances, controlled by VQM CS, enables to process important numbers of media files.
- The "Centralization mode": several VQM instances can be used as measurement probes, monitoring several Set-Top Boxes or to monitor several locations of a video broadcasting network, for example. In this configuration, VQM CS enables to gather (on a single machine) the measures of several VQM instances which run on one or several machines. Like VQM, VQM CS includes a web server which enables to generate the measurement reports. VQM CS offers the same types of reports as VQM but for several VQM probes in the same graph or table.
Conclusion
Enabling to work in both offline and online (real time) modes and with its elaborate quality metrics, VQM is definitely the solution that will adapt itself to answer your needs for video quality measurement and monitoring. Ask for an evaluation version today!
If you are interested by VQM but if you have only a punctual need or if you don't have the necessary manpower to fully exploit one license, please note that we also propose consulting services based on the use of VQM.